| |
|
12/17/08
The short answer is, “You follow it!”
Almost none of the traders and money managers alive have ever seen volatility similar to what we are experiencing today on a consistent basis. Something comparable occurred for a few days in 1987, but other than this brief case it hasn’t happened since the 1930’s. Most of the professionals did not study enough market history to understand the daily impact of the early 1930’s volatility. Thus, all market participants are confused and scared. They are all being faced with a huge threat they have never before seen.
Panics are extreme moves in price that occur in a relatively short
period of time and can occur on any time frame. Looking at the monthly
SP500 chart below it is clearly evident that we are in the middle of
a panic on this longer time frame. With the $VIX living between 40 and
90, panics on intraday charts are abundant - in fact they seem to happen
multiple times a week. There are buying panics as well as selling panics
but the market’s long bias makes the selling panics more extreme.

My first natural instinct was to try and time the turning point of the
panic. I would look at the irrationality and think, “This makes
no sense, when it ends, price will move back quickly in the opposite direction.”
If a market was selling off in a panic I would carefully try to spot the
climactic bottom where I would buy. I was sure the coming retracement
would be a significant move. After this philosophy proved to be a consistent
loser, I began studying the opposite approach.
I developed a few simple rules about trading panics that have produced a successful approach to these erratic markets. One of the most important concepts of a panic is that it will most likely get pushed much farther than one might think it would. I also believe that it is possible to spot a panic while it is occurring. These are simple points, but they can be quite powerful. If a panic can be spotted while it is occurring and it is likely to get pushed farther than seems possible, this means that I can profit by taking a trade in the direction of the panic.
What is the chance that when a panic is first identified, it was the very end? In October when did you realize that the market was in a panic on the daily charts? It is fairly easy to identify these panics well before they end and reasonable to expect that they can be identified near the middle of the move.
A panic can be identified by watching candlestick charts. When multiple
candles produce significant moves having little overlap in the candle
bodies with no retracements, this can be considered to be a panic. Basically
price is moving in one direction with a major imbalance of buyers and
sellers. If price is also breaking through a swing point or pushing new
extremes on a longer time frame, this will add credence to the likeliness
that a panic is underway. See the panic below on the SPY 5 minute chart
from December 11, 2008 (starting at 2:35pm).
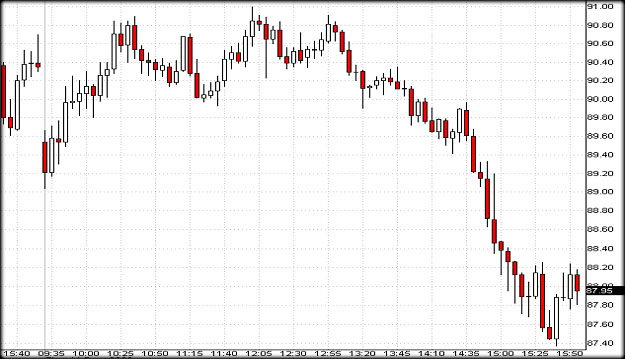
When a panic has confidently been identified, a stop market entry order is placed to take a position if the panic moves to a new extreme. Often times it is beneficial to drop down one time frame and trade on the shorter time frame. If the panic was spotted on a 5 minute chart consider trading on a 3 minute or 1 minute chart. A stop loss is implemented at the high from 2 bars prior. For example assume that SPY is in a selling panic on a 5 minute chart. It has traded down to 88.65 and is currently trading slightly above those lows (88.86). A sell short stop market order is placed at 88.64. A market order is executed when price moves to a new low and a buy to cover stop market order is placed at the high of the candle 2 time periods prior. This stop is trailed by continuously moving it down to the high from 2 periods prior until stopped out of the trade.
There are times when discretionary tightening of the stop loss is prudent. If one of the candles in the panic reaches a length (intra-period) that is significantly longer than any other candle during the day, the stop loss can be moved up to within a few pennies of the current price. Usually the trade will be stopped out quickly. If the panic is in full swing, price may immediately move down to a new level, keeping me in the trade. If this happens the extremely long candle is now even longer. Again move the stop to within a few pennies of the current price until stopped out.
Panics exhibit high volume which means many shares have changed hands; therefore, many people have recently established new positions. When price moves to a new extreme, every trader that has taken a position opposing the panic is now a loser and sees price quickly moving to new uncharted territory. As those losing traders are forced to cover their positions, they exacerbate the panic even further. This can be a cascading domino affect as chaos leads to more chaos. Proper money management practices include deciding how much money you are willing to risk and determining appropriate position size based on the location of a stop loss. With sound money management principals one should not be afraid to enter a trade in the direction of a panic as price pushes to a new extreme.
Bradley Okresik